Does Pitt Football Have a Problem Winning Close Games?
In recent years the Panthers had seemingly gained a reputation for blowing close games. Football teams blowing close games isn’t exactly a new phenomenon, but Pitt has seemingly made it an art form in recent times. The current era of “Pitting”, meaning Pitt’s tendency to blow games in a painful fashion at a higher than normal rate, began late in the Dave Wannstedt era.
Specifically, it was late in the 2009 season when Pitt lost close games to WVU and Cincinnati to squander a chance to win the Big East and go to the Sugar Bowl. Since then, most seasons have featured at least one egregious example of Pitt failing to close out a big game. The next year, the Panthers lost by 2 to UConn after leading late, preventing them from going to a BCS bowl for the 2nd straight year. In Todd Graham’s only season as Pitt Head Coach, the Panthers wasted a big lead against Iowa in a 4-point loss. When playing at Notre Dame in 2012, they blew a 14-point lead before losing in Overtime. When Duke came to town in 2014, the Panthers lost in Overtime after missing what would have been a game-winning field goal at the end of regulation.
While painful losses happen to every team from time to time, Pitt has seemed to experience more than their fair share of them in recent years. While this seems to be the case, there could be confirmation bias at work. Given the painfulness of some of these games, they may tend to stick in our mind more. It also seems as though there haven’t been as many of these painful losses since Pat Narduzzi took over. Do the statistics actually show this to be the case though? If so, is it the fault of the previous coaching staffs, the associated chaos, something else, or just the result of bad luck?
The Numbers
Though an imperfect metric, the most convenient way of measuring painful losses is to look at the results of close games. I compiled every game Pitt has played that had a final score within one possession (8 points) since 2005, Dave Wannstedt’s first season as Head Coach. Below are the year-by-year results with the first year of a new coaching regime indicated by that coach’s name:
| 1 Possession Games |
Pitt Wins |
Opp. Wins |
Total Games |
Pitt Win % |
||
| Wannstedt | 2005 | 0 | 3 | 3 | 0% | |
| 2006 | 0 | 1 | 1 | 0% | ||
| 2007 | 3 | 4 | 7 | 43% | ||
| 2008 | 4 | 2 | 6 | 67% | ||
| 2009 | 4 | 3 | 7 | 57% | ||
| 2010 | 1 | 3 | 4 | 25% | ||
| Graham | 2011 | 2 | 5 | 7 | 29% | |
| Chryst | 2012 | 0 | 3 | 3 | 0% | |
| 2013 | 4 | 2 | 6 | 67% | ||
| 2014 | 1 | 5 | 6 | 17% | ||
| Narduzzi | 2015 | 5 | 4 | 9 | 56% | |
| 2016 | 3 | 4 | 7 | 43% | ||
| 2017 | 2 | 3 | 5 | 40% | ||
| Total | 29 | 42 | 71 | 41% | ||
This doesn’t provide a pretty picture as 9 of the 13 seasons saw Pitt winning less than 50% of their one possession games. Over the course of these 13 seasons Pitt has a total record of 29-42 in these games for a 41% winning percentage. Below are the results compiled into 3 separate coaching eras to better illustrate the trend. I combined the one Todd Graham season with Paul Chryst’s 3 seasons for sample size reasons and because it fits better with the Chryst years to form a period covering the coaching instability of the early 2010’s.
[table id=2 /]
While none of the coaches have a winning percentage of at least 50% in 1 score games, Wannstedt and Narduzzi are at least close while the Graham and Chryst years saw Pitt winning such games less than a third of the time. The disparity can be more effectively illustrated in the graphic below:

Looking at one possession games can be misleading though, as games that may not have been very close can become close late as a team is trying desperately to come back. A good example of this is the game with Miami in 2015, when Pitt scored two quick touchdowns late to make the final margin respectable. Instead, it’s a little more helpful (and painful) to look at games that ended within a Field Goal:
| 3 Point Games |
Pitt Wins |
Opp. Wins |
Total Games |
Pitt Win % |
|
| Wannstedt | 2005 | 0 | 1 | 1 | 0% |
| 2006 | 0 | 1 | 1 | 0% | |
| 2007 | 1 | 1 | 2 | 50% | |
| 2008 | 2 | 1 | 3 | 67% | |
| 2009 | 2 | 2 | 4 | 50% | |
| 2010 | 0 | 2 | 2 | 0% | |
| Graham | 2011 | 0 | 3 | 3 | 0% |
| Chryst | 2012 | 0 | 2 | 2 | 0% |
| 2013 | 3 | 1 | 4 | 75% | |
| 2014 | 0 | 2 | 2 | 0% | |
| Narduzzi | 2015 | 2 | 1 | 3 | 67% |
| 2016 | 3 | 2 | 5 | 60% | |
| 2017 | 0 | 2 | 2 | 0% | |
| Total | 13 | 21 | 34 | 38% | |
The winning percentage is a little lower than 1 possession games, but given the small sample sizes, they’re basically equivalent. In either case, it’s significantly lower than the approximate 50% winning percentage that should be expected. Below are the same coaching eras looked at above for 3-point games:
[table id=3 /]
These figures are similar to what we see when looking at all 1 possession games. This can be seen in the graphic below:
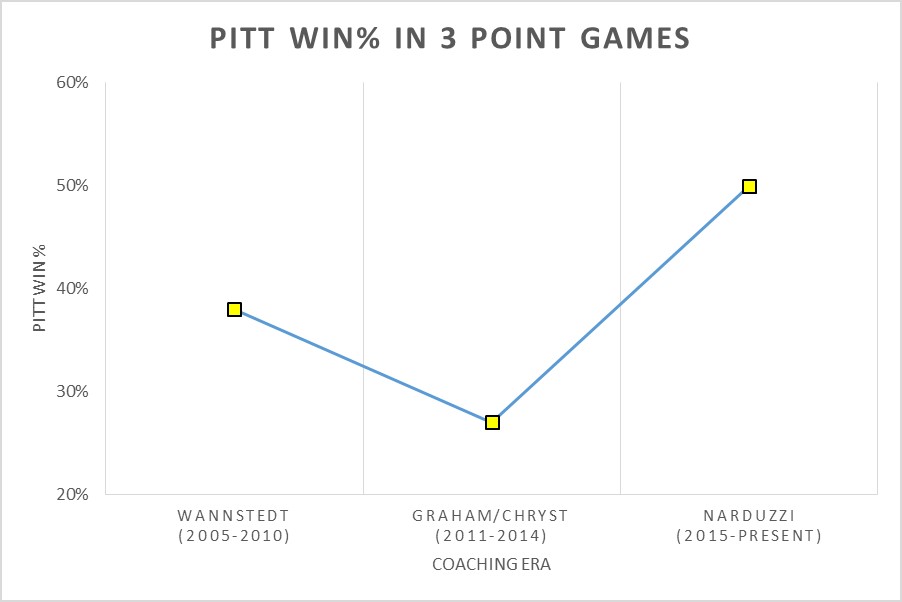
These low percentages aren’t even simply the result of a relatively small sample size. Since 2005, Pitt has played in 34 games decided by 3 points or less, which is more than all but 5 FBS teams over this period. They went 13-21 in these games for a winning percentage of 38%. This figure is only higher than 8 other FBS schools that have played at least 20 such games over this time. The 21 total losses in these games is also only lower than one other team (Iowa with 26). If we only look at the games since 2009, when the current era of “Pitting” can be said to have started as mentioned above, it looks even worse. Since then Pitt has 17 losses of 3 points or less, tied with Iowa for the most such losses over this period. Any way I slice this, Pitt has been on the short end of close games more often than we would want to see and the statistics do bear out the perception that Pitt has an issue winning close games.
While these numbers don’t paint a pretty picture, the dips in winning percentage of close games during the era of coaching turmoil is not that surprising if you look at the overall records during that period:
[table id=4 /]
And in graphic form:
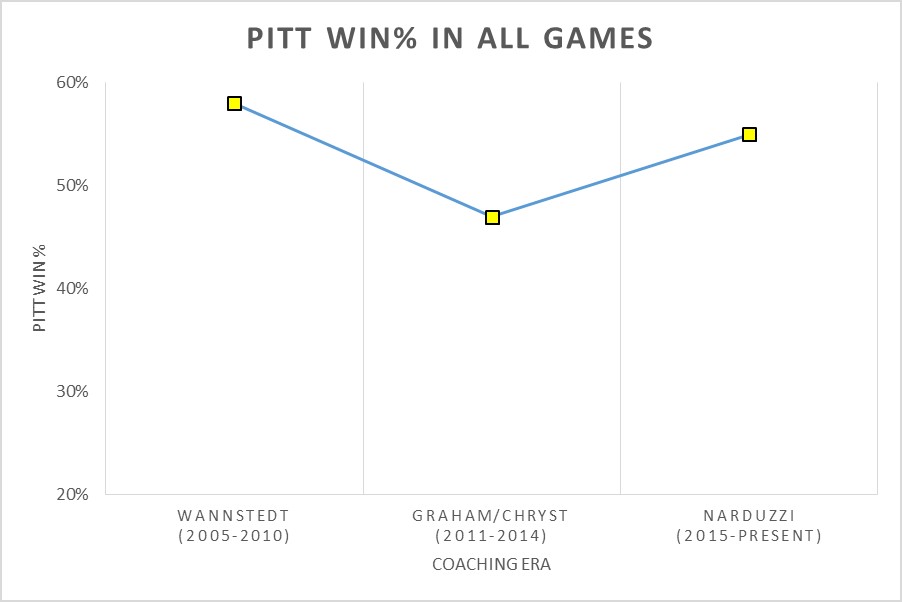
As you can see, the dip is present in the overall record as well. This implies that it is unlikely that the coaching turmoil had a significant impact on how Pitt did in close games. What’s undeniable though is that Pitt has underperformed as a whole in close games since at least 2005. One could make the argument that you shouldn’t expect Pitt to win close games around 50% of the time, but instead at around the rate of their overall winning percentage. However, it should already be obvious that Pitt still underperforms by that metric. In case you need to see it more plainly:
| Difference in Win % compared with All Games | 1 Possession Games | 3 Point Games |
| Wannstedt | -15% | -20% |
| Graham/Chryst | -15% | -20% |
| Narduzzi | -8% | -5% |
| Total | -13% | -16% |
Since 2005, Pitt’s winning percentage in close games has been significantly lower compared with their overall mark. It also applies in both 1 possession games and 3-point games across all three coaching eras. I will note though that Pitt’s winning percentage in both categories is below 10% during the Narduzzi regime compared with them being at least 15% in both of the other eras. This supports the notion that Pitt hasn’t been as seemingly cursed in close games in recent years. However, this era also has the smallest sample size, so there could still be significant movement over the next few years in either direction.
Bad Luck?
I’ve now hit you with a lot of examples and figures that show how Pitt has struggled in close games and tied it to the concept of “Pitting”. You may have been thinking throughout this article, “Hey, I’m the rare rational Pitt fan who understands that these numbers are all still covering a relatively small sample size and that this will even out.” You may be right, but here’s the thing, I’ve shown that Pitt has consistently won close games at lower than expected rates for almost a decade and a half. At some point you’d expect some “regression to the mean”, with Pitt starting to win close games at closer to expected levels. As the chart above shows though, we maybe have seen the beginning of this regression with the Pat Narduzzi coached Panthers.
…Maybe Not
Let’s also entertain the idea that maybe there’s something more going on with Pitt over the last 13 years than simply bad luck. One may be tempted to say that Pitt’s particularly bad run in close games from 2011-2014 was due to the coaching turmoil seen around the beginning of that period. This could be due to the resultant bad run of recruiting combined with having a first-time head coach during the remaining years. However, this doesn’t hold up under scrutiny as the rates of winning close games was depressed identical amounts compared to the overall winning percentages from the Wannstedt era. Additionally, the idea that an inexperienced head coach would have a hard time closing out close games doesn’t hold up either as Pat Narduzzi is also a first-time head coach and has had slightly more luck than any of his three immediate predecessors.
Another hypothesis is that these coaches are simply not good at closing out tough games. Paul Chryst and Todd Graham have been 9-6 (60%) and 12-11 (52%) at Wisconsin and Arizona State respectively in 1 possession games since leaving Pitt. Both of these marks are above a 50% winning percentage, but lower than their overall win percentage at those schools (83% and 59% respectively). However, Paul Chryst has a very high 83% winning percentage overall in his first 3 years at Wisconsin, which would be an unsustainably high mark to have in 1 possession games. For reference, even Nick Saban at Alabama has an 87% winning percentage overall, but only a 59% winning percentage in 1 possession games. As for Todd Graham, his numbers are close enough given the sample sizes. In any case, it doesn’t look like who the head coach was had any effect on why Pitt has struggled in close games during this era.
Could it be Conditioning?
One final hypothesis I want to look at is the possibility that the Pitt coaching staff may not have simply had their players conditioned enough over the years. When players aren’t in as good condition as their opponents, it makes it awfully hard to close out games that are hanging in the balance late. It’s difficult to quantify how effective a program’s strength and conditioning program is, but we can look at who the Panthers have employed to head up that area. What we see is a period of instability during the coaching turmoil. After having the program headed up by Buddy Morris from 2007-2010 under Dave Wannstedt, the Panthers had 3 separate Strength and Conditioning Coaches over the next 4 seasons. Currently, that position is held by Dave Andrews who came aboard when Pat Narduzzi was hired. Perhaps some stability in that area has paid dividends in the slight uptick in results of close games that we’ve seen over the last three seasons? There’s no way to tell for sure, but it’s the best hypothesis I can come up with other than just plain bad luck.
At the End of the Day…
Losing close games is always frustrating, but the idea is that in the long run a team will win and lose about half of these types of games. That hasn’t been the case for Pitt in recent years though for whatever reason. It has probably resulted in Pitt “leaving some wins on the field” over the years. There’s some reason for optimism in this area though, between stability in the strength and conditioning program and normal regression to the mean. However, it doesn’t make any of the painful losses detailed above any easier to swallow. Last season, Pitt went 5-7 and missed a bowl game for the first time since 2007 by one game. They also went 0-2 in 3-point games. Pitt needs to start winning these close games at the very least at an average rate in the future. Next time they go winless in 3-point games it may keep them out of the ACC Title Game or even the College Football Playoff rather than just a minor bowl.
Any ideas on why Pitt has a hard time closing out games? Tell us by commenting below or tweeting @IntoPitt or directly at me @TheJeemTeam
*Stats courtesy of College Football Reference